Option Explicit
Private Sub Form_Resize()
On Error Resume Next
WebKitX1.Move 0, 0, ScaleWidth, ScaleHeight
Err.Clear
End Sub
Private Sub Form_Load()
' Load Human Machine Interface markup
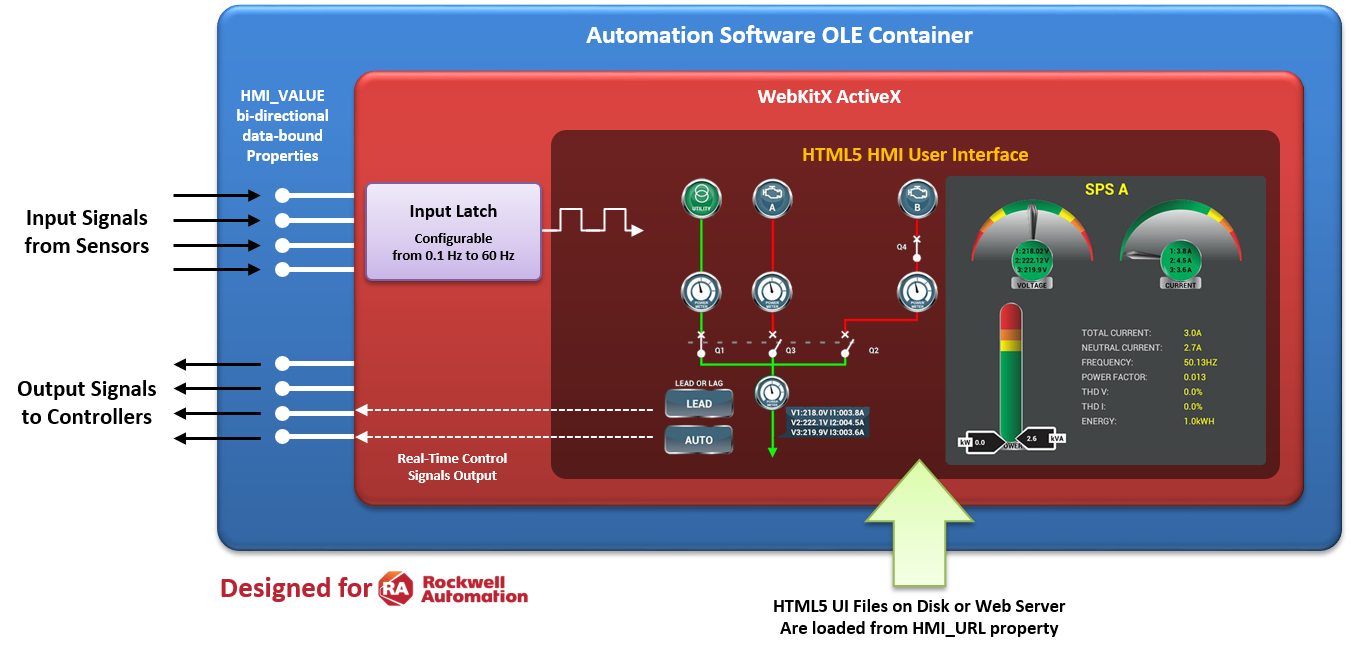
WebKitX1.HMI_URL = "file:///" + App.Path + "/index.html"
End Sub
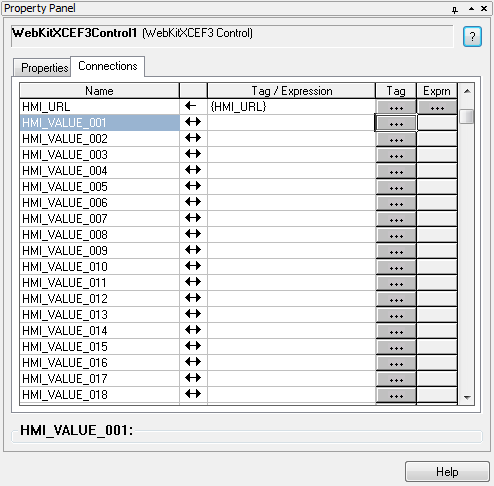
Private Sub WebKitX1_OnCreate(ByVal Settings As WebKitXCEF3Lib.ISettings, CommandLineSwitches As String)
' Set WebKitX HMI values to flush/refresh at rate 1Hz (every 1sec).
Settings.hmi_input_clock_frequency_hz = 1
End Sub
Private Sub WebKitX1_OnPageComplete(ByVal url As String)
' We use a timer at 60Hz to simulate high-frequency sensors.
Timer1.Interval = (1000 / 60)
Timer1.Enabled = True
End Sub
Private Sub Timer1_Timer()
' We read values from "sensors" and pass them to six (6) different HMI I/O channels.
' We read sensor values 60 times per second (every ~16ms). WebKitX uses input latches
' to retain input values and flush them to HTML at a rate of 1Hz (every 1sec).
WebKitX1.HMI_VALUE_001 = Rnd * 1560
WebKitX1.HMI_VALUE_002 = Rnd * 1560
WebKitX1.HMI_VALUE_003 = Rnd * 1560
WebKitX1.HMI_VALUE_004 = Rnd * 1560
WebKitX1.HMI_VALUE_005 = Rnd * 1560
WebKitX1.HMI_VALUE_006 = Rnd * 1560
End Sub
Private Sub WebKitX1_OnHMIControlSignal(ByVal Index As Long, ByVal Data As String)
Debug.Print Format(Time, "HH:MM:SS") & " > HMI_VALUE_" & Format(Index, "000") & " = " & Data
End Sub
<!DOCTYPE html>
<html lang="en" >
<head>
<meta charset="UTF-8">
<title>Gauge Chart</title>
<link rel="stylesheet" href="https://cdnjs.cloudflare.com/ajax/libs/meyer-reset/2.0/reset.min.css">
<link rel='stylesheet' href='https://fonts.googleapis.com/css?family=Open+Sans:400,700'>
<link rel="stylesheet" href="./style.css">
</head>
<body>
<center>
<br>
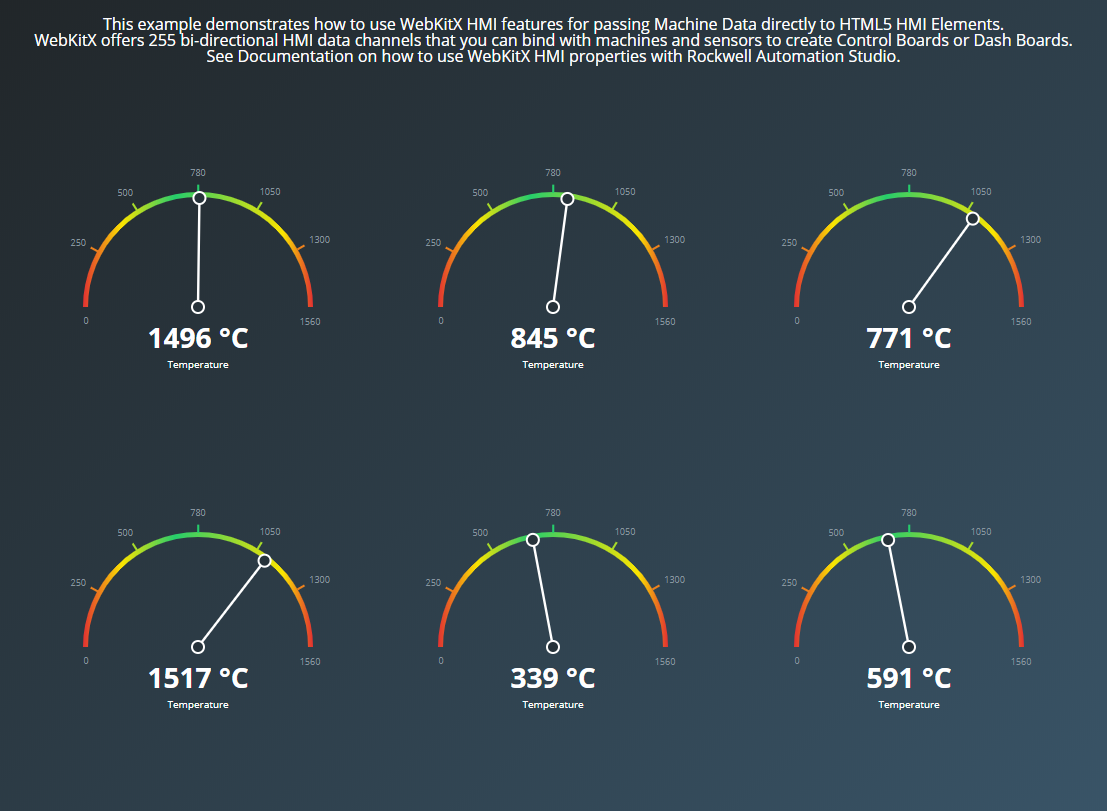
This example demonstrates how to use WebKitX HMI features for passing Machine Data directly to HTML5 HMI Elements.
<br>
WebKitX offers 255 bi-directional HMI data channels that you can bind with machines and sensors to create Control Boards or Dash Boards.
<br>
See Documentation on how to use WebKitX HMI properties with Rockwell Automation Studio.
</center>
<main class="main">
<div class="gauge-container">
<div id="gauge1" class="gauge"></div>
<div id="gauge2" class="gauge"></div>
<div id="gauge3" class="gauge"></div>
</div>
<div class="gauge-container">
<div id="gauge4" class="gauge"></div>
<div id="gauge5" class="gauge"></div>
<div id="gauge6" class="gauge"></div>
</div>
</main>
<svg width="0" height="0" version="1.1" class="gradient-mask" xmlns="http://www.w3.org/2000/svg">
<defs>
<linearGradient id="gradientGauge">
<stop class="color-red" offset="0%"/>
<stop class="color-yellow" offset="17%"/>
<stop class="color-green" offset="40%"/>
<stop class="color-yellow" offset="87%"/>
<stop class="color-red" offset="100%"/>
</linearGradient>
</defs>
</svg>
<script src='https://cdnjs.cloudflare.com/ajax/libs/jquery/2.0.2/jquery.min.js'></script>
<script src='https://cdn3.devexpress.com/jslib/17.1.6/js/dx.all.js'></script>
<script src="./script.js"></script>
</body>
</html>
$(function () {

  class GaugeChart {
    constructor(element, params) {
      this._element = element;
      this._initialValue = params.initialValue;
      this._higherValue = params.higherValue;
      this._title = params.title;
      this._subtitle = params.subtitle;
    }

    _buildConfig() {
      let element = this._element;

      return {
        value: this._initialValue,
        valueIndicator: {
          color: '#fff' },

        geometry: {
          startAngle: 180,
          endAngle: 360 },

        scale: {
          startValue: 0,
          endValue: this._higherValue,
          customTicks: [0, 250, 500, 780, 1050, 1300, 1560],
          tick: {
            length: 8 },

          label: {
            font: {
              color: '#87959f',
              size: 9,
              family: '"Open Sans", sans-serif' } } },


        title: {
          verticalAlignment: 'bottom',
          text: this._title,
          font: {
            family: '"Open Sans", sans-serif',
            color: '#fff',
            size: 10 },

          subtitle: {
            text: this._subtitle,
            font: {
              family: '"Open Sans", sans-serif',
              color: '#fff',
              weight: 700,
              size: 28 } } },

        onInitialized: function () {
          let currentGauge = $(element);
          let circle = currentGauge.find('.dxg-spindle-hole').clone();
          let border = currentGauge.find('.dxg-spindle-border').clone();

          currentGauge.find('.dxg-title text').first().attr('y', 48);
          currentGauge.find('.dxg-title text').last().attr('y', 28);
          currentGauge.find('.dxg-value-indicator').append(border, circle);
        } };


    }

    init() {
      $(this._element).dxCircularGauge(this._buildConfig());
    }}


  $(document).ready(function () {

    $('.gauge').each(function (index, item) {
      let params = {
        initialValue: 780,
        higherValue: 1560,
        title: 'Temperature',
        subtitle: '780 °C' };

      let gauge = new GaugeChart(item, params);
      gauge.init();
    });

  });
});

function OnHMIDataSignal(index, randomNum)
{
	randomNum = parseInt(randomNum);
	let item = $('.gauge')[index-1];
	let gauge = $(item).dxCircularGauge('instance');
	let gaugeElement = $(gauge._$element[0]);
	gaugeElement.find('.dxg-title text').last().html(randomNum+' °C');
	gauge.value(randomNum);
}