Even though WebKitX has built-in Chromium Developer Tools accessible through ShowDevTools method, there is a far more efficient way to debug your HTML5 / JavaScript applications by using Visual Studio Code. Visual Studio Code is a free source-code editor made by Microsoft for Windows, Linux and macOS. Features include support for debugging, syntax highlighting, intelligent code completion, snippets, code refactoring, and embedded Git.
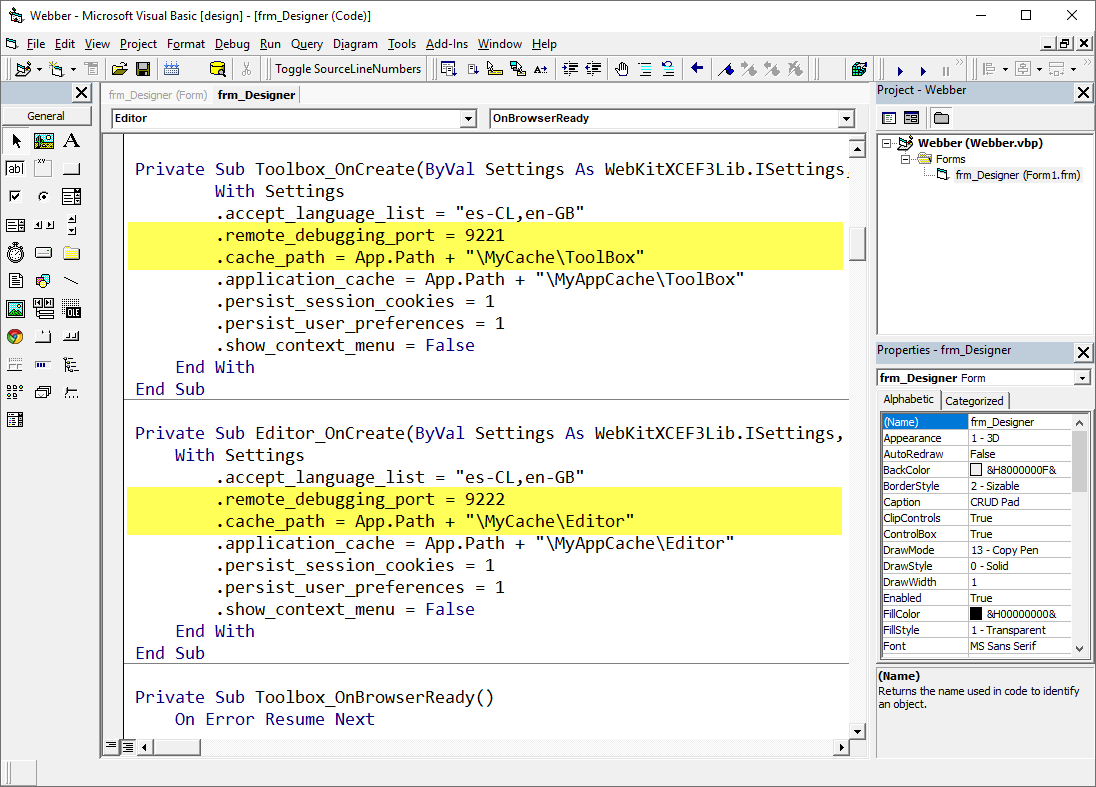
Configure your WebKitX executable for remote debugging by handling the OnCreate event and defining remote_debugging_port and cache_path. In the example below we use two (2) WebKitX controls and we enable remote debugging on both controls. If you are developing a similar application, you must assign different port to each control as well as different cache path. The process is illustrated in Visual Basic 6 but it is the same for any other programming language.
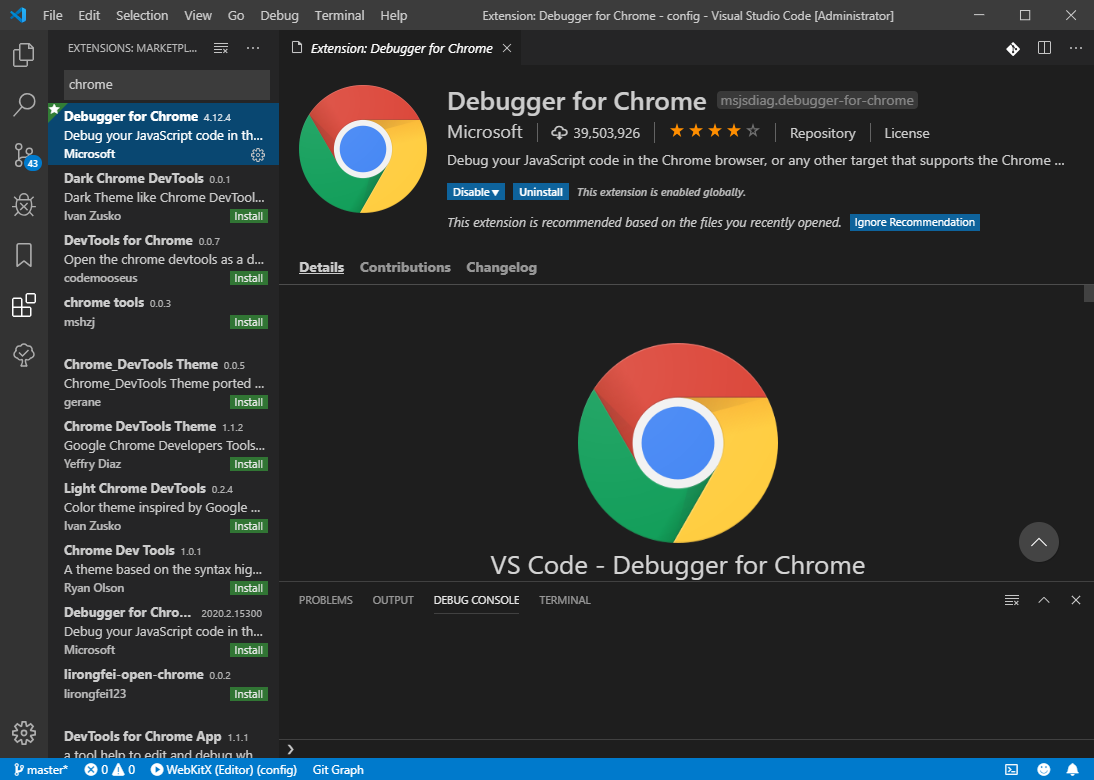
Since WebKitX is a Chromium wrapper, you must install Debugger for Chrome plugin in your Visual Studio Code.
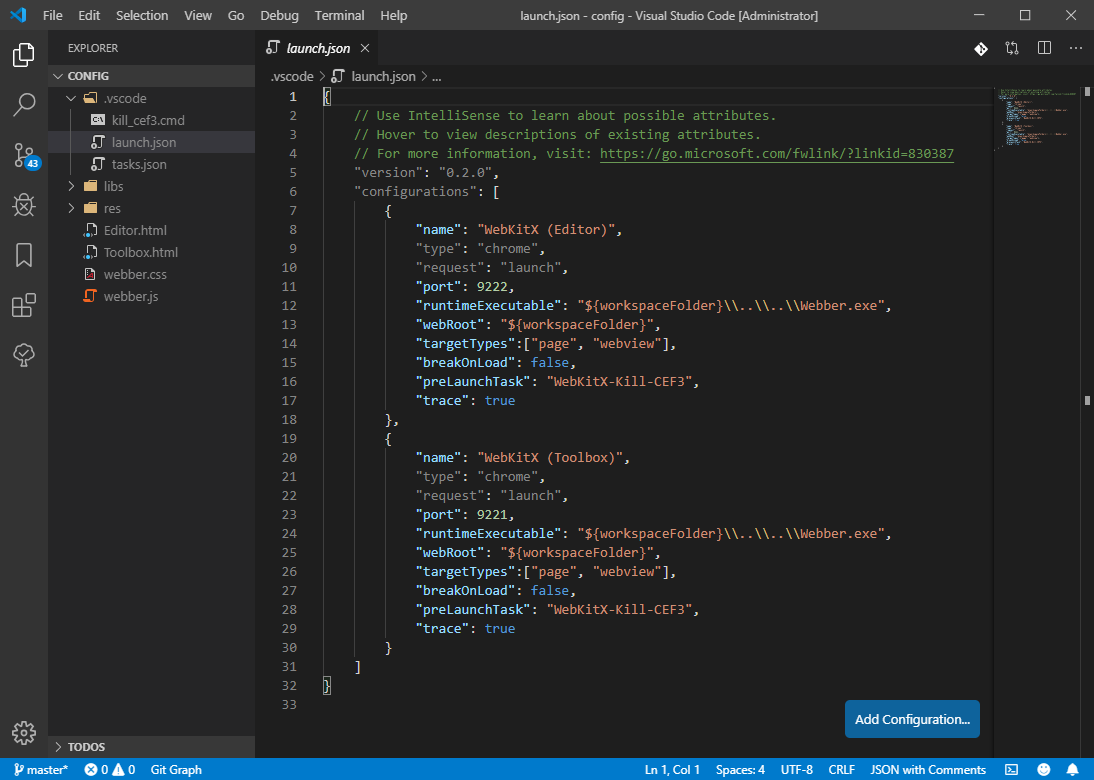
You must create a new launch.json file and define the runtimeExecutable parameter to point to your applications executable. We recommend defining breakOnLoad to false and the port parameter must be the same port number used in previous step. Also define a preLaunchTask that is explained further below. If you need to debug two or more controls we recommend adding several configurations with different debug port numbers as illustrated below.
| launch.json |
Copy Code |
|---|---|
{
    // Use IntelliSense to learn about possible attributes.
    // Hover to view descriptions of existing attributes.
    // For more information, visit: https://go.microsoft.com/fwlink/?linkid=830387
    "version": "0.2.0",
    "configurations": [
        {
            "name": "WebKitX (Editor)",
            "type": "chrome",
            "request": "launch",
            "port": 9222,
            "runtimeExecutable": "${workspaceFolder}\\..\\..\\Webber.exe",
            "webRoot": "${workspaceFolder}",
            "targetTypes":["page", "webview"],
            "breakOnLoad": false,
            "preLaunchTask": "WebKitX-Kill-CEF3",
            "trace": true
        },
        {
            "name": "WebKitX (Toolbox)",
            "type": "chrome",
            "request": "launch",
            "port": 9221,
            "runtimeExecutable": "${workspaceFolder}\\..\\..\\Webber.exe",
            "webRoot": "${workspaceFolder}",
            "targetTypes":["page", "webview"],
            "breakOnLoad": false,
            "preLaunchTask": "WebKitX-Kill-CEF3",
            "trace": true
        }
    ]
} | |
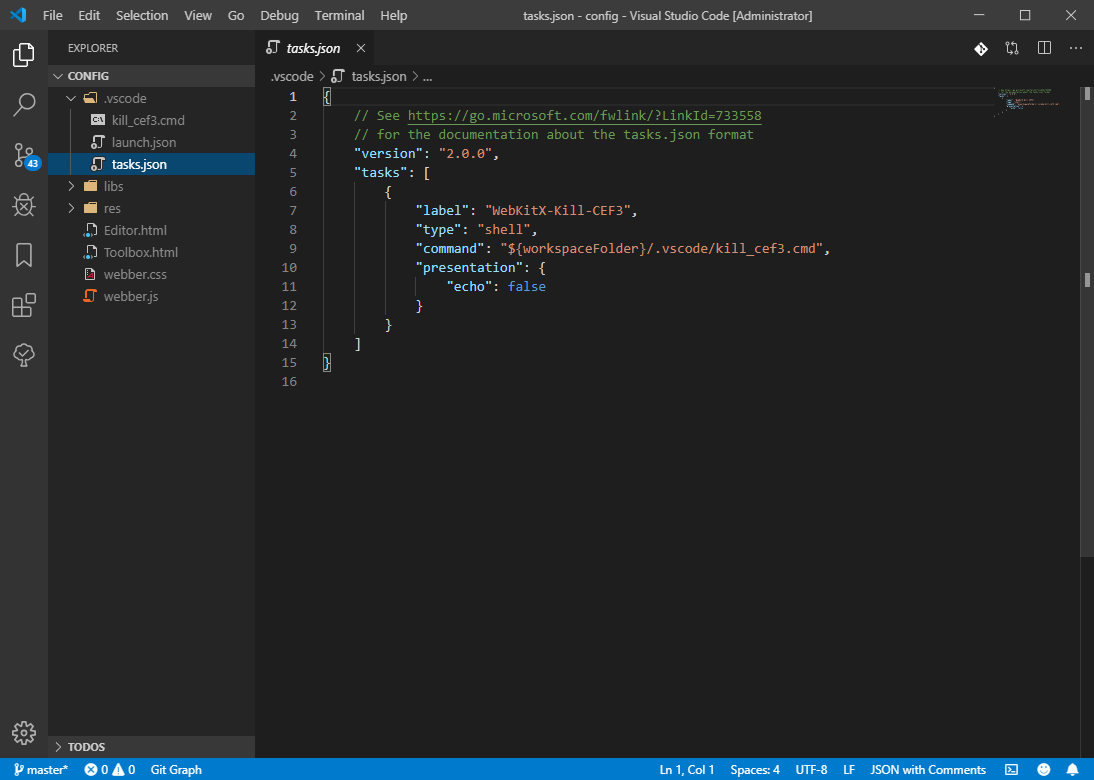
WebKitX relies on CEF sub-processes named CEF3XClient.exe and instantiates several of them during its operation. If you kill the debugger those processes remain orphan and leak resources. We recommend adding a tasks.json file with the following code that will kill orphan processes.
| tasks.json |
Copy Code |
|---|---|
{
    // See https://go.microsoft.com/fwlink/?LinkId=733558
    // for the documentation about the tasks.json format
    "version": "2.0.0",
    "tasks": [
        {
            "label": "WebKitX-Kill-CEF3",
            "type": "shell",
            "command": "${workspaceFolder}/.vscode/kill_cef3.cmd",
            "presentation": {
                "echo": false
            }
        }
    ]
} | |
And add this command in kill_cef3.cmd file:
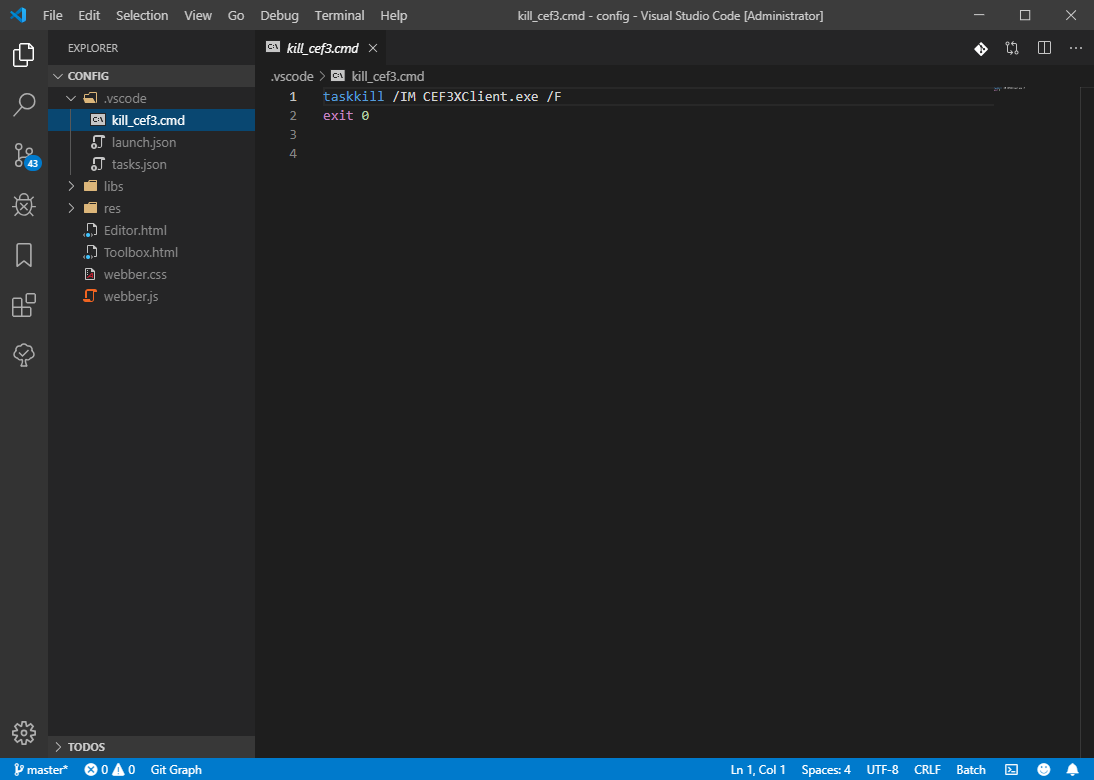
| kill_cef3.cmd |
Copy Code |
|---|---|
taskkill /IM CEF3XClient.exe /F exit 0 | |
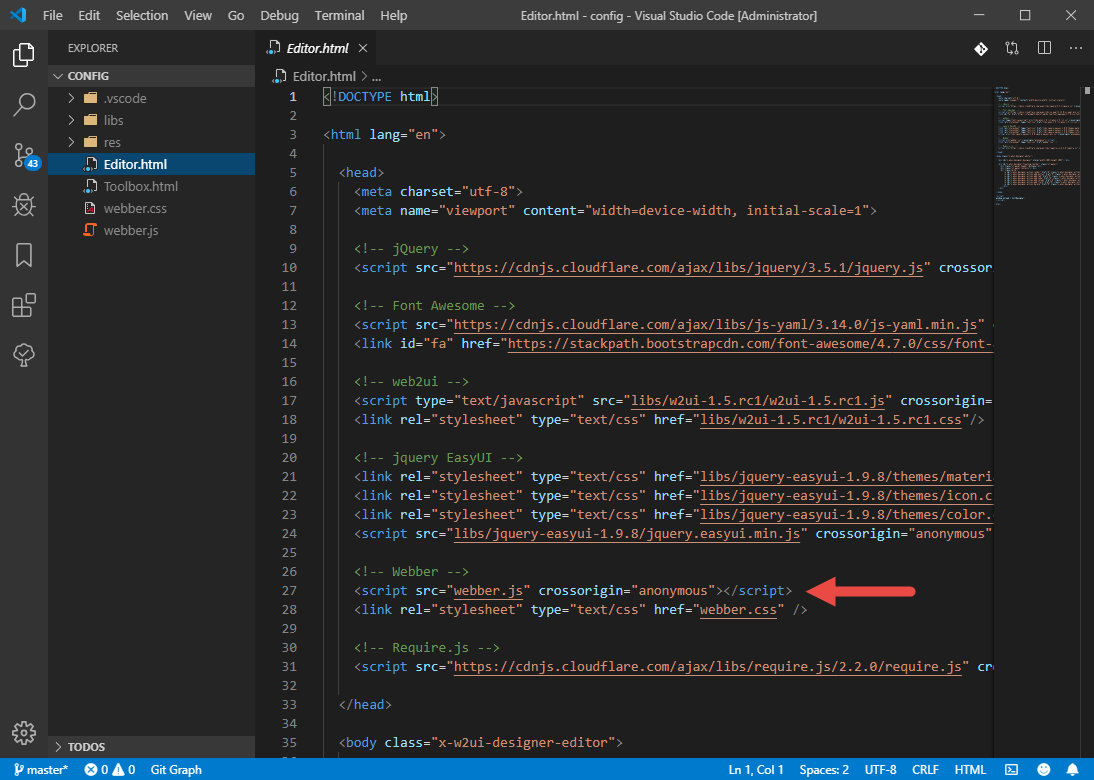
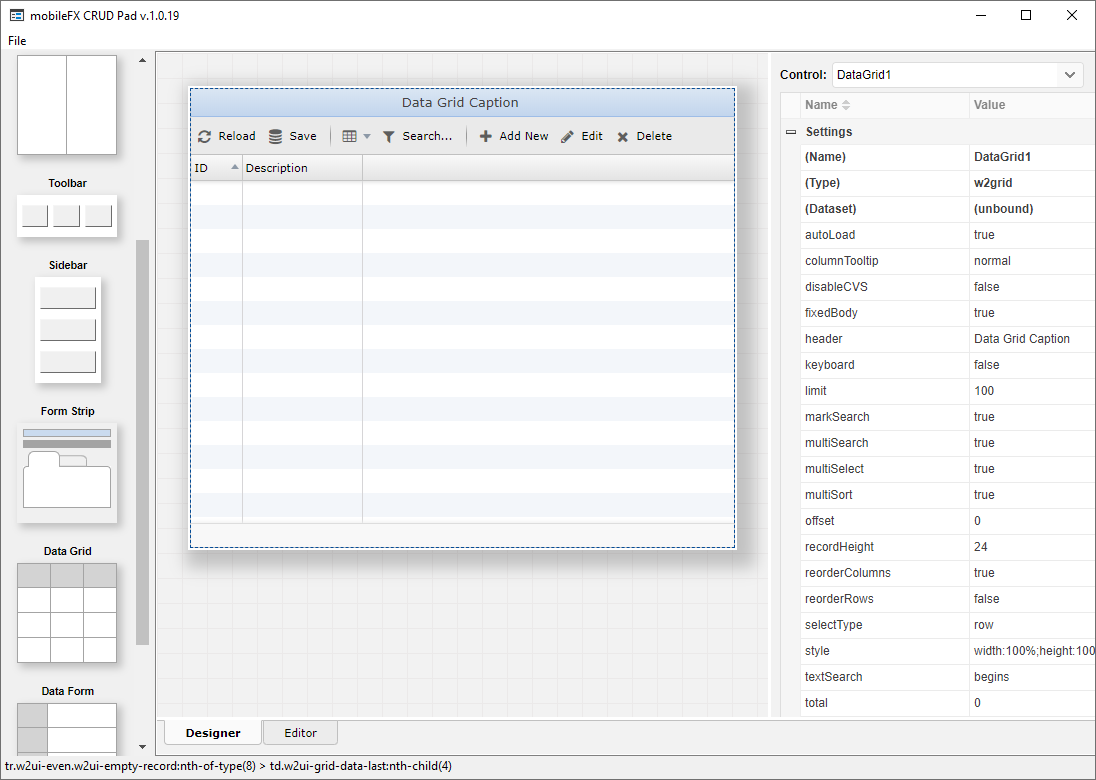
Now, in this demo we load file Editor.html in WebKitX browser which in turn loads webber.js JavaScript file. In the example we want to debug webber.js.
We open webber.js in Visual Studio Code and set a Breakpoint to the function we want to debug.
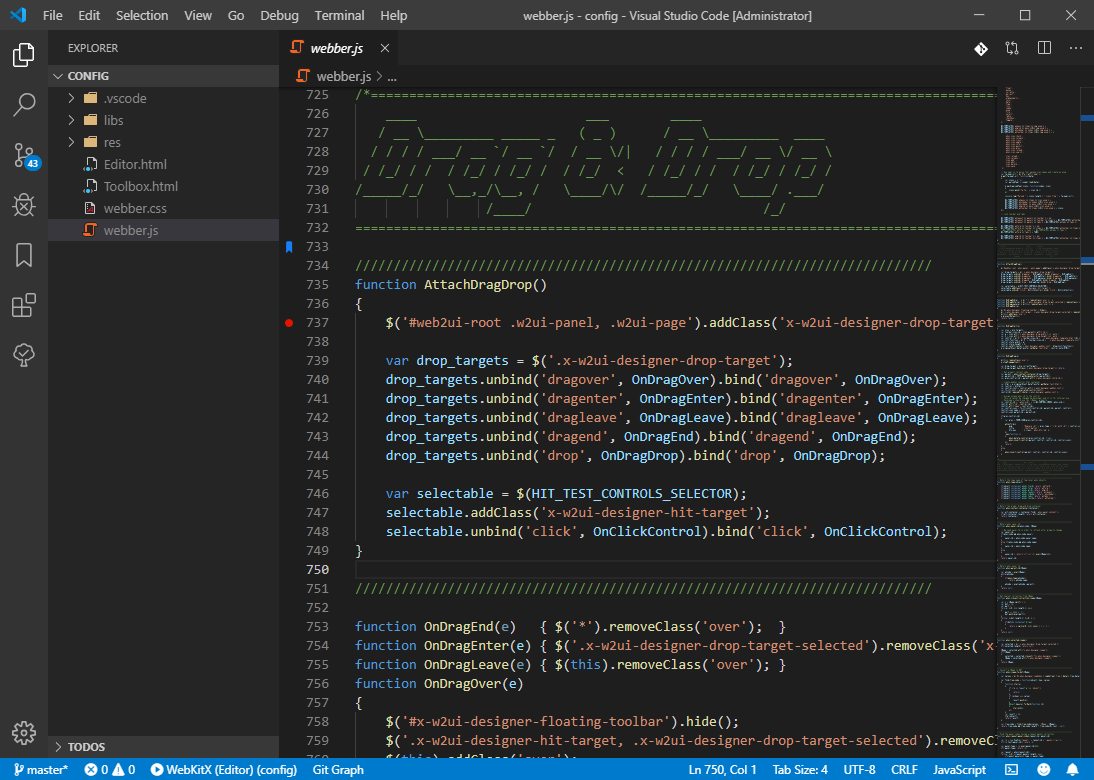
When we start Visual Studio Code debugger it will launch Webber.exe and hit our breakpoint as illustrated in the two next images.
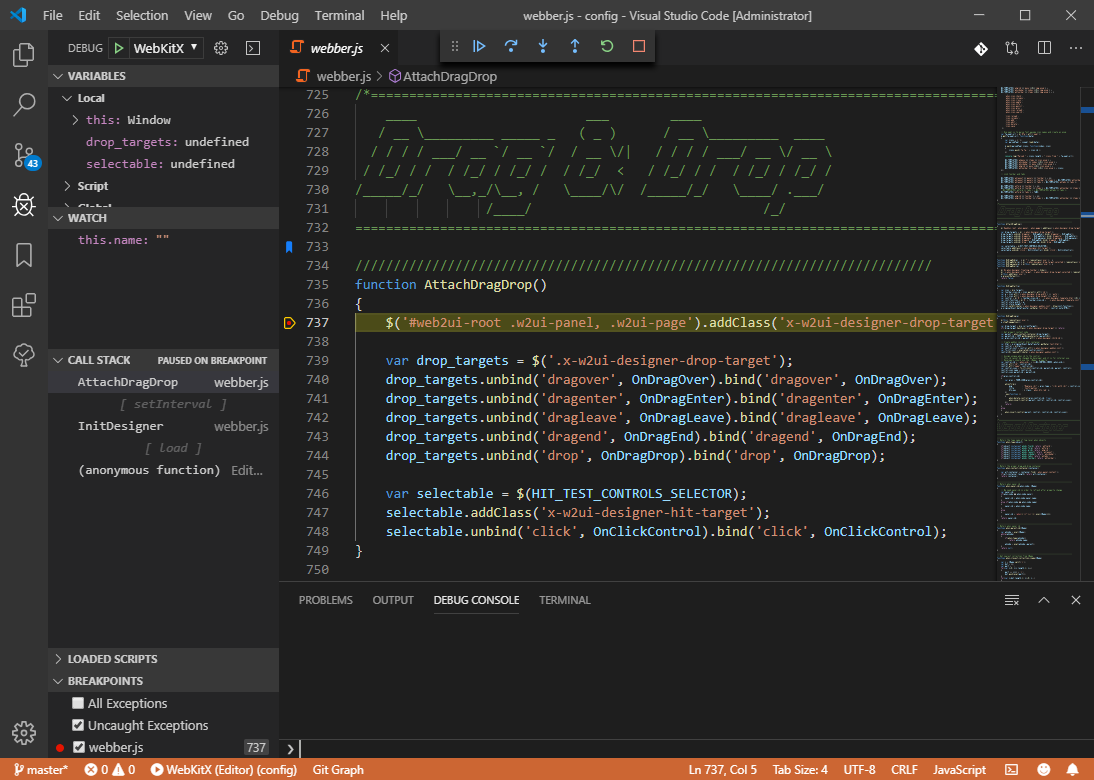
From now on you can take full advantage of Visual Studio Code.